This guest article was written by Nicolas Tröger. Nicolas is a software developer and computer science student specializing in software engineering, cloud, virtualization, and IT security. He has also gained hands-on experience in data engineering, particularly in building data pipelines and working with open data.
What This Post Covers
- Why open data matters and how it can be used for real-world impact (e.g. crisis response, climate research)
- What open data actually is
- Practical guidance on:
- Where and how to find reliable open datasets
- Evaluating metadata, formatting, and accessibility
- Understanding and verifying dataset licenses
- Practical example: Investigating the link between storm-related casualties and public opinion on climate policy across U.S. states
- Key challenges when dealing with open data: broken links, missing context, unclear licenses – and how to navigate them
In April 2015, a powerful earthquake struck Nepal, resulting in thousands of casualties and damaged homes. Amid the widespread devastation, an innovative response emerged – not from helicopters or supply trucks, but from data. Nepal’s largest mobile operator, Ncell, shared anonymized call data with the non-profit organization Flowminder, which used it to map population movements in real time. This allowed aid workers and government agencies to deliver resources more effectively, reaching the people who needed help the most (Verhulst, 2017).
This example shows how data – especially when made open or shared responsibly – can become a critical tool for solving real-world problems. From crisis response and public health to urban planning and environmental protection, open data helps us make better decisions based on evidence, not assumptions.
But what exactly is open data? How is it different from other types of data, and how can you find it? What are the current challenges in dealing with open data as a user who wants to use such datasets? This first article, as the first in a series of three, introduces the concept of open data and provides practical guidance on where and how to search for high-quality, trustworthy open datasets, as well as its challenges and how to deal with them.
Practical example: Influence of climate-related events on support for climate change countermeasures
To gain a clearer understanding of how to work with open data, this section walks through a hands-on example, starting with a motivating research question. Throughout the process, relevant links to the involved websites will be provided, along with general information on selected topics.
With average world temperature records being at an all-time high year after year, climate change is an ever-present topic that affects the world. Understanding how direct exposure to climate-related disasters influences public opinion is crucial, as such events may serve as powerful motivators for political and social change. In democratic systems like the U.S., public support is often a key driver of environmental policy. That’s why we investigate whether people living in U.S. states more severely affected by weather-related disasters – such as storms, floods, or tornadoes – are more likely to support political action against climate change. To do this, we explore the relationship between weather-related casualties and public opinion on climate action across different states.
“Are people living in states with more casualties caused by climate-related events more likely to support countermeasures against climate change?”
What is open data?
According to the Open Knowledge Foundation and their definition, open data refers to data that is freely available for anyone to access, use, modify, and share for any purpose.
They summarize the characteristics of open data as follows:
Characteristics of open data
- Availability and access:: Data should be available as a whole, at a cost no higher than the cost of reproduction, preferably as a free download on the Internet. The work should also be available in an appropriate and modifiable form.
- Use and re-use: The data must be made available under conditions that allow use, re-use and association with other data sets. The data must be machine-readable.
- Universal participation: Everyone must be able to use, re-use and re-distribute the data. There must be no discrimination against any persons or groups. The subsequent use may not be limited to individual areas (e.g. only for educational purposes), nor may certain types of use (e.g. for commercial purposes) be excluded.
Open data is typically shared via publicly accessible platforms such as data portals or websites, often in table-based formats (e.g., CSV), and ideally accompanied by metadata that provides context (e.g., column explanations, value descriptions) and a license clarifying usage rights.
Practical example: Searching for open data
We can identify two variables:
- Casualties caused by climate-related weather events
- The political opinion about action against climate change in that very same state
As a first step, the search focused on identifying data representing storm-related casualties per U.S. state. Since the research topic concerns the U.S. population, a simple search such as “open data us” quickly lead to several official platforms, primarily hosted by the U.S. government.
Following this approach, we consult the official data.gov portal – the central platform for open datasets provided by the U.S. government. A search for storm event data yields several relevant results, including a promising dataset series from the National Centers for Environmental Information (NCEI), focused on storm-related events and their impacts.
However, accessing the actual data, and under which it’s licensed, proves more complex than expected. The data itself is not hosted directly on data.gov. Even after selecting the sub-entry titled “Storm Events Database,” users are redirected through several parts of websites and subdomains as shown in Figure 1. Eventually, this process leads to the NOAA (National Oceanic and Atmospheric Administration) website, where an FTP and HTTP access point allows for downloading the bulk datasets, along with corresponding metadata files.
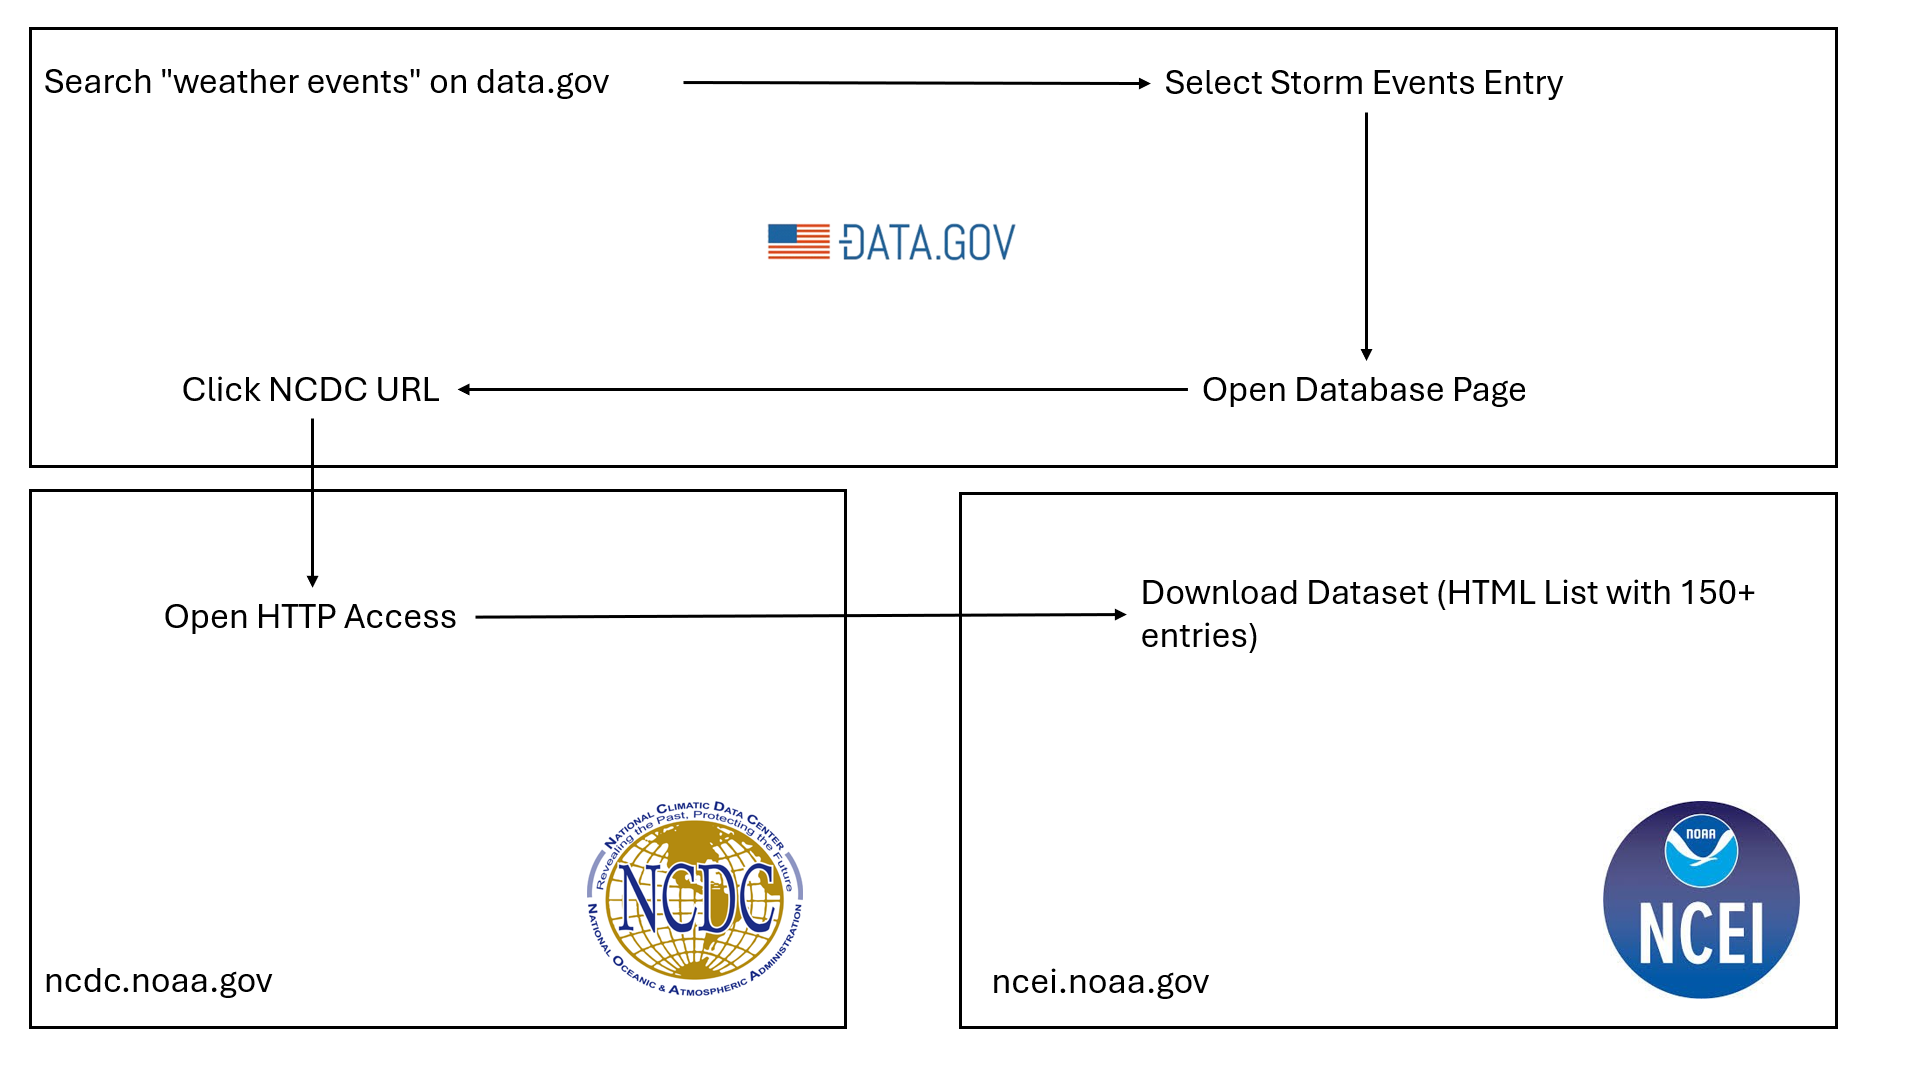
This experience illustrates that, while open data may be publicly accessible in principle, retrieving and making sense of it is often unintuitive – particularly for those unfamiliar with the infrastructure. Moreover, the availability of metadata is not guaranteed. In many cases, essential context or documentation is missing, requiring direct inquiries to the dataset authors.
More broadly, it becomes apparent that working with open data often comes with usability challenges. Datasets are sometimes published as a legal or institutional obligation rather than out of voluntary transparency, which can result in poorly maintained portals, missing metadata, outdated links, or confusing file structures. In addition to these barriers, questions about licensing – and how to determine the conditions under which datasets may be used – present an additional layer of complexity, which will be addressed further in the following sections.
Open data portal overview
Open data is by no means a purely american or european initiative. The global landscape of central open data portals spans across continents. In Asia, countries like Singapore and Japan host national platforms (e.g., data.gov.sg, data.e-gov.go.jp), while India and Kenya represent active contributors from South Asia and Africa (data.gov.in, kenya.opendataforafrica.org).
In Europe, the United Kingdom and the European Union maintain comprehensive portals (data.gov.uk, data.europa.eu). Meanwhile, countries in North America – including Mexico, Canada, and the United States – operate well-established platforms like datos.gob.mx, open.canada.ca, and data.gov.
Beyond national platforms, international organizations such as the United Nations and the World Bank also maintain large-scale global datasets, accessible via data.un.org and data.worldbank.org.
Going deeper, there are also many field-specific databases:
| Field | Example Datasets / Sources |
|---|---|
| Environment & Climate | – NOAA Storm Events (USA) – Copernicus Climate Data Store (EU) – NESP (Australia) |
| Public Health | – CDC Data Portal (USA) – WHO Global Health Observatory (Global) – KDCA (South Korea) |
| Economy & Labor | – U.S. Bureau of Labor Statistics – Eurostat (EU) – World Bank Open Data – Japan Statistics Bureau |
| Urban Planning & Transport | – US DOT DataHub – OpenStreetMap (Global) – Transport for London – India Smart Cities Data |
| Agriculture & Food | – FAO Data (UN) – Agmarknet (India) – USDA ERS (USA) |
| Education | – U.S. Department of Education Data – OECD Education Stats – India’s AISHE Portal |
| Crime & Justice | – FBI Crime Data Explorer (USA) – UK Police Data – National Crime Records Bureau (India) |
| Energy & Utilities | – EIA Open Data (USA) – ENTSO-E Transparency Platform (EU) – India's URJA Dashboard |
While there are many open data platforms covering a wide range of fields and geographic areas, this abundance can also create challenges. It’s often unclear where to look for the most relevant or reliable dataset, and users may struggle to judge whether they’ve found the best available source. Geopolitically, datasets hosted by a specific country (e.g., the U.S.) may contain global information, yet this isn’t always obvious. For instance, a U.S.-based repository might hold climate data with worldwide coverage, but users might wrongly assume it only includes national data. This can lead to confusion, uncertainty, and missed insights – especially when searching for something like global weather or climate event data, which may be scattered across multiple platforms.
Practical example: Finding dataset licenses
After identifying a suitable dataset, the next essential step is to verify under which license it is published. This process can be unexpectedly frustrating, but it’s crucial – using a dataset without understanding its legal terms can lead to serious issues, especially in professional or public-facing work.
In the ideal case, the dataset includes a clear license statement directly next to the download link, explicitly outlining the permitted uses. Best practice for open data is to use standardized licenses such as the Open Data Commons licenses or Creative Commons licenses. These provide legal clarity and make reuse much easier.
However, in our case – the storm weather dataset – no license information is provided at the direct download location (via NOAA’s HTTP or FTP access point). This raises uncertainty: can the data be reused freely or not?
Therefore the idea is to go one level higher. Due to how the storm weather datasets are organized as an offical series of datasets provided by the NOAA, there might be a general claim of how the entire dataset series is licensed. In our case we can’t find any specific dataset series license, atleast not at the HTTP-Accesspoint.
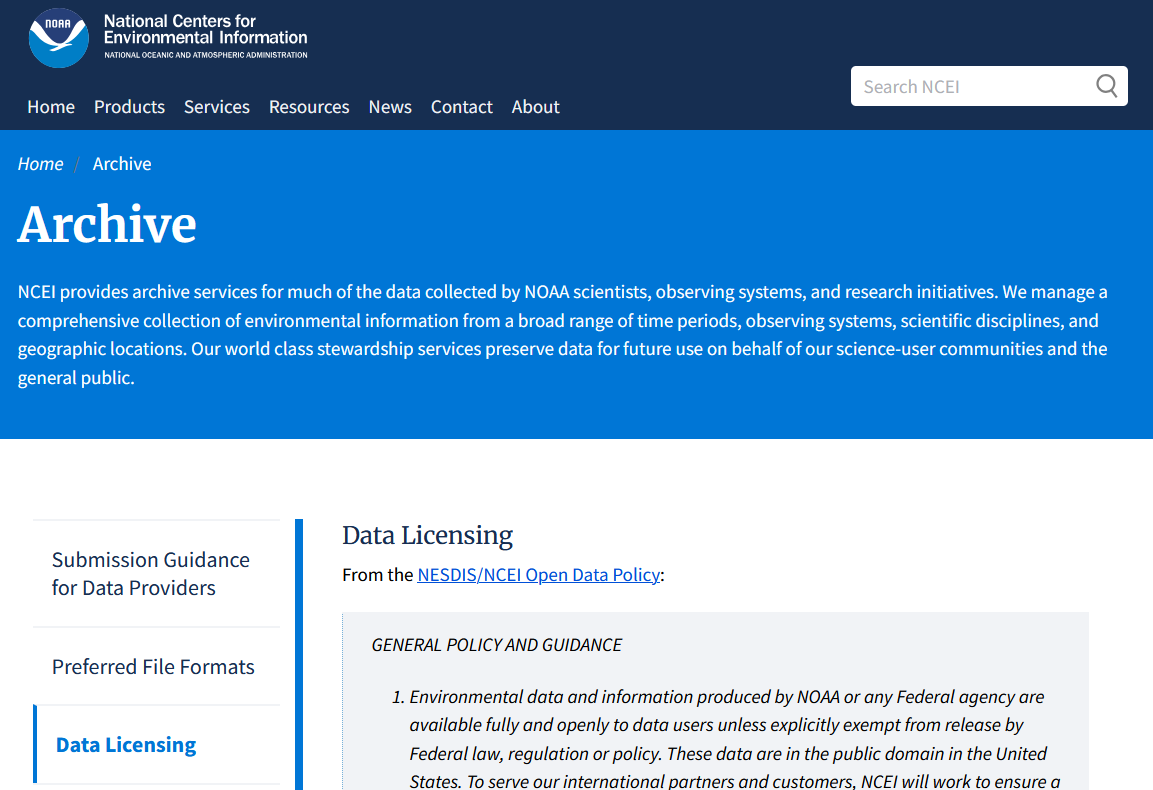
To resolve this, we take a step back and examine the source more broadly. Since the data is published by the National Centers for Environmental Information (NCEI), a sub-agency of NOAA, we revisit the NCEI’s official webpage to look for licensing statements. Unfortunately, no specific license is mentioned for the storm events dataset series.
Eventually, we find a general policy on the NOAA and NCEI websites stating that datasets published by U.S. government agencies – particularly when created by federal employees – are considered public domain. This means they are freely accessible, usable, and redistributable, as long as the source agency is acknowledged. While it would have been preferable to find a license attached directly to the dataset, this broader statement provides sufficient legal grounding for usage in our case. According to NOAA policy, the only condition is to include a statement specifying the agency source alongside the data.
For the second variable, we need data that reflects public opinion on climate change policy across U.S. states. Unlike the previous example, this dataset isn’t available through official government open data portals like data.gov. Instead, a general web search leads us to the Yale Climate Opinion Maps, published by Yale University. This resource provides visualizations of how Americans across different states and counties respond to various climate-related questions – including their level of support for political action against climate change. A download link for the raw data is also provided.
To verify whether this dataset qualifies as open data, we search for licensing information. The relevant details are listed in the FAQ section, which includes a legal notice outlining the terms of use:
“The YPCCC hereby grants to the User a non-exclusive, revocable, limited, non-transferable license to use the data solely for (1) research, scholarly or academic purposes, (2) the internal use of your business, or (3) your own personal non-commercial use. You may not reproduce, sell, rent, lease, loan, distribute or sublicense or otherwise transfer any data, in whole or in part, to any other party, or use the data to create any derived product for resale, lease or license.”
At first glance, this license seems to permit academic use, but a closer look reveals significant restrictions. The license excludes commercial applications, prohibits redistribution or sublicensing, and – most critically – is revocable. These terms are incompatible with standard open data definitions, which require that data be freely reusable and redistributable by anyone, for any purpose. Additionally, access to the download requires subscribing to a university newsletter – another barrier to openness. Hence we proceed to look for older data.
While this dataset might suffice for a one-time academic project, it falls short of open data principles. In cases like this, it’s often worth checking whether older versions of the dataset were published under more permissive terms. Sometimes such strict conditions (compared to open data licenses) are specificlly on the latest datasets, especially when provided by commerical organizations.
A deeper search – this time specifically for “Yale Climate Opinion Maps” – leads us to an official GitHub repository maintained by the Yale School of the Environment. There, we find an older dataset version from 2020, made publicly available under the MIT License. This license allows free use, modification, and redistribution with minimal restrictions. The repository also includes metadata describing the structure and variables in the dataset, which improves usability.
This example illustrates that even when a dataset appears closed or restricted, alternative versions might exist in more accessible forms. You will notice that there are many different platforms in use for hosting downloadable data (e.g. GitHub), for example when an institution lacks a dedicated data infrastructure. When in doubt, reaching out to the authors or data providers directly is always recommended – especially to clarify unclear or missing licensing information.
Note: Software licenses like MIT can be used for data, but dedicated data licenses (e.g. Open Data Commons, etc.) are better suited and more appropriate for datasets.
Lastly, after identifying and verifying the licenses of our datasets, it’s important to quickly review the metadata and check whether the relevant variables are present and clearly defined. Even without diving into full analysis yet, a first glance at the actual data should confirm that key variables are properly formatted – for example, consistent units and value types. More detailed data cleaning will follow in the next blog post, but an early check helps avoid investing time in a dataset that turns out to be unusable.
In the storm weather dataset, for instance, there’s a column for financial damages formatted with suffixes like “320K” or “450M” instead of full numeric values (e.g., “320,000”, "450,000,000). Depending on the tools used later, this could require additional processing, going as far as to not be usable, depending on the tools we have at our hands. For our purposes, the formatting is acceptable because we are interested in a different variable – but this step is essential to evaluate early on.
Conclusion
Open data has the potential to unlock powerful insights across fields – from public health and climate science to urban planning and policy-making. When freely available, clearly licensed, and well-documented, it empowers individuals, researchers, and organizations to explore important questions and base decisions on evidence rather than assumptions. However, as this article has shown, working with open data in practice requires more than simply downloading a file from a website.
Understanding what qualifies as open data is essential. It’s not enough for data to be publicly accessible – it must also be reusable and redistributable without restrictive terms. This usually requires a clear, standard license. Especially when data comes from private or non-governmental sources, users must assess whether it truly meets open data criteria.
Finding high-quality open data can be challenging. While many national and international portals exist, they differ widely in usability, reliability, and completeness. Datasets may lack metadata, be hard to navigate, or be buried under broken links. Knowing how to search effectively and evaluate the trustworthiness of sources is a key part of working with open data.
Even when data appears usable, licensing details require close attention. Terms may limit commercial use, redistribution, or long-term availability. Additionally, performing quick quality checks – like reviewing metadata, variable formatting, and structural consistency – helps avoid issues later during analysis or cleaning. Taking these steps early ensures smoother use of the data throughout a project.
To summarize, some of the most important lessons when starting to work with open data are:
-
Be clear on what constitutes open data – and recognize when data falls short of that standard.
-
Develop a strategy for finding datasets, especially across diverse portals and international sources.
-
Always verify licensing – don’t assume open access equals open use.
-
Assess usability early – checking metadata, formats, and completeness before diving in.
-
Expect variability – open data is not uniform, especially in terms of presentation, ease of availability and format.
This foundational awareness is what enables users to work with open data effectively – whether for research, journalism, application development, or civic engagement. In the next part of this series, we’ll move from data search to data engineering: cleaning and preparing real-world open datasets for analysis, combining multiple sources, and overcoming the messy realities of working with public data.
AI Disclaimer
During the preparation of this work the author, as a non-native speaker, used LanguageTool and ChatGPT in order to improve wording, grammar and spelling. After using these tools, the author reviewed and edited the content as needed and takes full responsibility for the content.
Links
- Storm Weather Event Dataset Series (2020): https://www.ncei.noaa.gov/pub/data/swdi/stormevents/csvfiles/StormEvents_details-ftp_v1.0_d2020_c20240620.csv.gz
- Yale-Climate-Change-Opinion-Maps (2020): https://github.com/yaleschooloftheenvironment/Yale-Climate-Change-Opinion-Maps
Sources
Verhulst, S. G. (2017). Corporate Social Responsibility for a Data Age. Stanford Social Innovation Review. https://doi.org/10.48558/NASP-XV09
Comments
2 responses to “Working With Open Data: A Practical Guide For Curious Minds”
[…] Read the first post here → […]
[…] will work with two datasets that were found in our the first blog post of the series and capture both the physical impact and the public […]